
Do Stats Matter
As many would know I am a very new player to competitive Grifball. I may arguably be the worst player in the league, though some may disagree I am objectively statistically the worst player of the league. The stats do not lie. Or do they? For as long as I’ve been around, I’ve been told some variation of stats don’t matter. However, if they don’t matter than why do we track them? Stats are important and most certainly do matter, but can they be the end all for a good player, more importantly can they predict which team going to be the champion of any given season? Well let’s take a look at the stats for the last season, FL20.
First it will be important to note that our stats simply do not track enough. That is not a fault of the tireless tacticians that track them but because in this game there are simply too many untrackable or hard to track stats. In many games K/D is king the more kills and less deaths directly correlate to victory. However, that is not the case in Grifball. Last season the team with the best total K/D was Team U.S.A. who went a combined +666. This team did not make playoffs. However, the team with the worst overall K/D, Apocalypse Ponies dropped a massive –830 on the season and still made it to the championship game. Yet they did lose to a team with a much better K/D than them. Ascended, with just a +21. So clearly K/D, while important, is not the perfect measure of success.

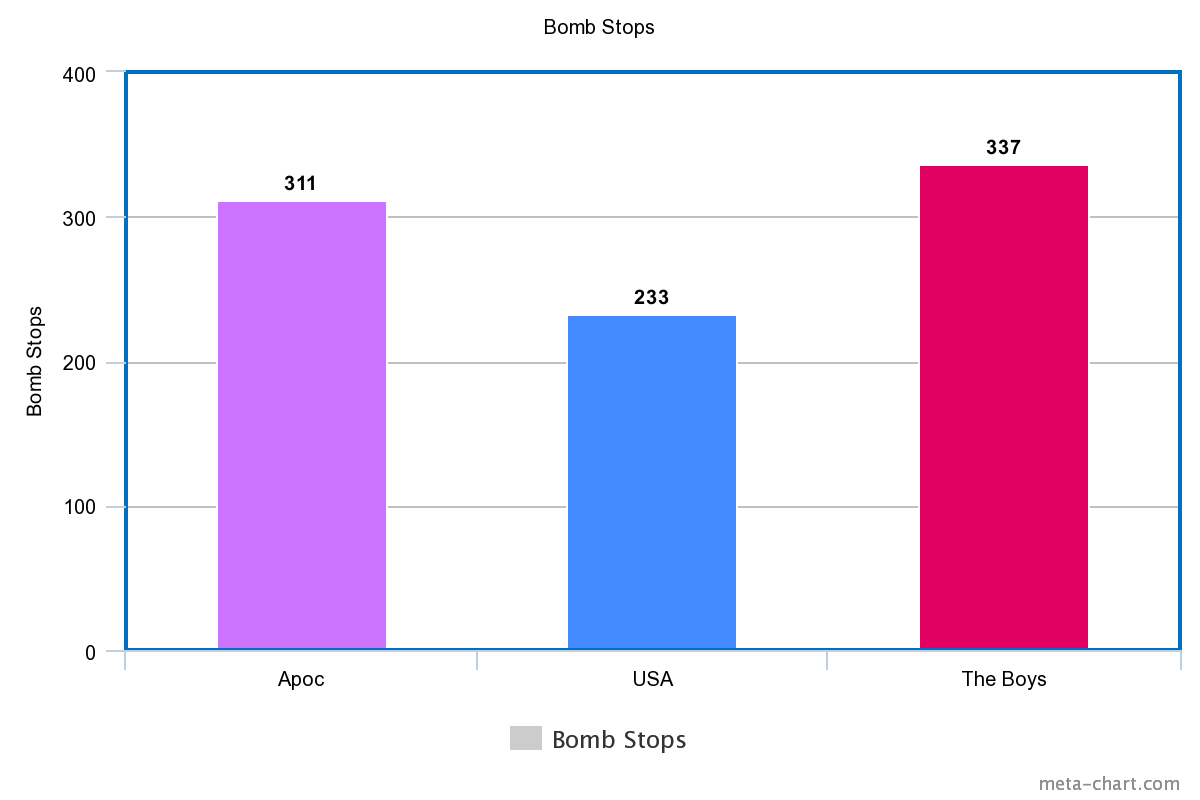
In Grifball deaths seems to be less important than kills, deaths, in some situations, can lead to strategic developments in the game without kills. So, I want to look at total kills, but still that alone won’t be enough, let’s compare total kills + multikills. Team U.S.A had good number of kills. 8218 with 1183 being double kills alone, but again they did not make play offs. A team that did make playoffs, A and the Spences, had 700 less total kills at 7632 but only 140 less doubles at 1041. Likewise, the ponies had significantly less kills than U.S.A at 6452. Thas a 1760 difference between kills and a 279 difference between doubles as the ponies have a total of 904 doubles. Infact the only stat that the ponies really seem to have above U.S.A. is bomb stops. The ponies have 78 more stops with a total of 311 against U.S.As 233.

However, stops is still not a good measurement for which stats equal wins as The Boys have the most stops on the season with 337 despite only having a 3-17 record. As I’m sure you’re screaming by now, comparing number to number just won’t tell us anything relevant. It all depends on context and game time, as some teams played over 4 hours more than others.
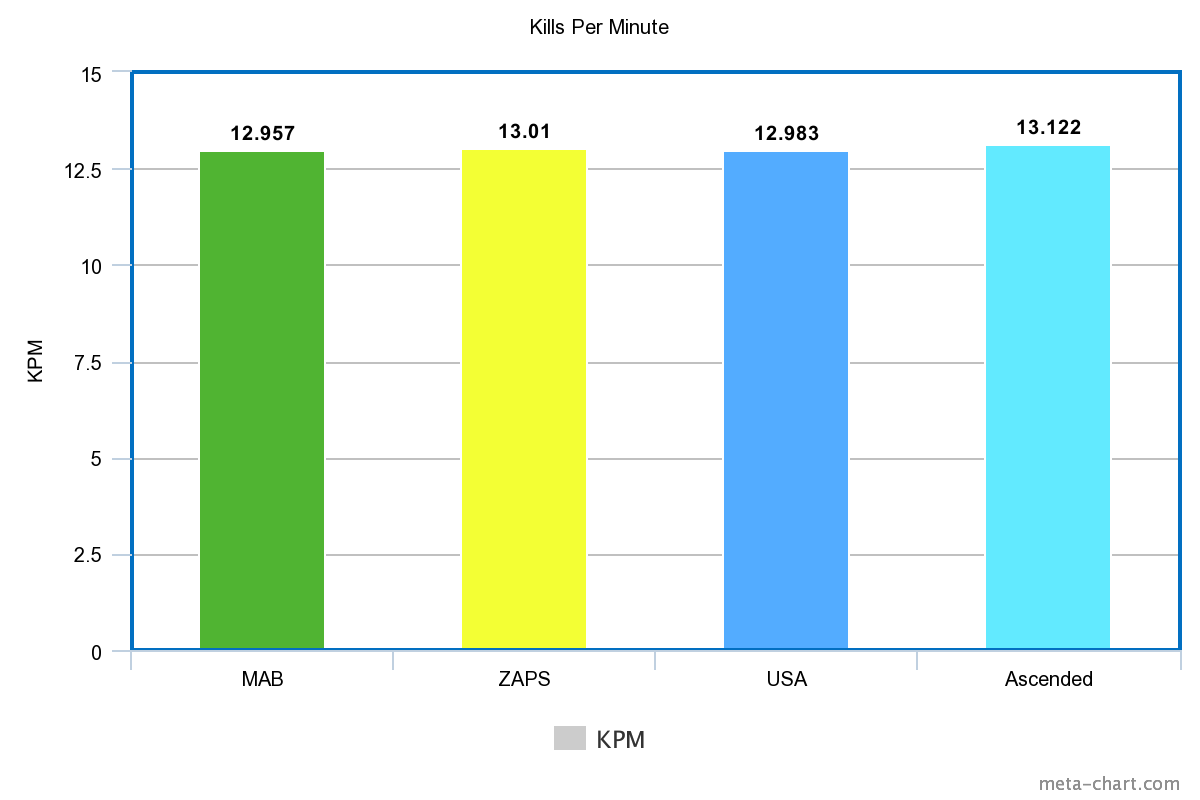
So, let’s move away from just raw numbers and start looking at per minute stats. Things get a little more interesting here. The ship winning team of ascended has the most kills per minute at 13.122, followed by zaps with 13.01. Then after that we get our k/d and kills leader Team U.S.A. at third place with 12.983 only .030 away from MAB who had 12.957 kills per minute. Despite U.S.A. having 1895 more kills than MAB their kills per minute is almost identical.
However, that isn’t even the most fascinating comparison with per minutes stats. MAB was a 2nd seed team and many peoples favorite to win it all, yet their per minute stats are almost identical to A Junkyard Dog. AJYD had 12.953 kills a minute, that’s .004 less than a 2nd seed team. Likewise, their doubles a minute is 1.831 compared to MABs 1.84. On paper these teams might as well be identical yet one of them went 15-5 while the other went 6-14.

Our second place team ApocPo look even worse on paper with per minute stats, they are the 8th place team for both kills and doubles with 12.602 K/PM and 1.766 doubles/PM. In fact, the only stat they look good in and actually lead the pack in is stops per minute with 0.607 S/PM giving them a 0.24 lead over the next team being Ascended. Interestingly Ascended only leads the board on K/PM and while they make it into the top 3 on some other stats a lot of these per minute stats have them middle of the board. So, while per minute stats seem to be a much more accurate depiction of a team doing well on the court, it certainly still does not equal wins. It especially wouldn’t predict a world where ascended and ApocPo are the two teams in the finals.
So maybe team stats aren’t the best metric to use here, perhaps the answer lies in player vs player stats. Despite having the most bomb stops, 104 of the boys stops all came from Silva. That’s 30% of their total stops. Likewise, Alpha Turtle had 28% of his team’s total stops and Digital has 39% of his teams stops. Similarly, with kills Dig makes up 35% of his teams kills. For many Digital was considered the best H3 player, so it’s no shock he contributed heavily to his team’s massive k/d, let’s compare him to some of the first rounders in the draft.

First our peoples champion Halfbreed, who overall had a worse k/d a min than Dig. Halfbreed went .87 KD/M to Digs 1.39 KD/M When you add up all the multikills they got Halfbreed had .853 multikills/PM to digs 1.072 multis/PM. So, these two are pretty close and Halfbreed number wise deserves his 1st pick spot and the playoff spot he earned. However, our 2nd round pick had a worse season than I think anyone would have predicted. Galvann is a great tank that can’t be disputed. Yet a .39 KD/M is not great for him. Still, he really picks up the slack with his multikills. .973 multis/PM. Higher than Halfbreed. Maybe still not on the digital level of stats, but there is one stat Galvann is higher than Dig in. Assists per minute. Dig is a kill hog, he has only .008 A/PM comparatively Halfbreed .017 a respectable amount. Galvann has even more A/PM granted not by much. He totals out at about .20 A/PM. Also, our third pick and breakout star of the show, AceBs1lent, has .18 A/PM a .91 KD/M and .834 multis/PM. Very close to both Dig and Halfbreed.

Arguably looking at these stats you could make a case for Ace being first pick over Halfbreed and I doubt anyone could dispute it. So, what does that tell us about these 4 players and what happened this last season? We’ll it confirms that dig hype was indeed real and he certainly was deserving of his last pick, however he didn’t make play offs. There are obviously a lot of reasons for that and the blame should not put on him alone when there are a lot of factors at play outside of these stats. What we can infer from these stats however is that despite being a massive kill presence on the court he is not leaving much for his team to help with. Those assists are negligible and while assists maybe the least cared about stat, they can show us how good of a team tank someone is. Halfbreed stat wise was great but not as great as dig, yet he made playoffs while having a much greater A/PM so his team is tanking well around him and picking up what slops he leaves, likely resulting in games getting won. Same can be said about Ace, 1st seeded team playing well together and picking up where others may be dropping off. Pair that with a great KD/M for Ace and that’s a solid team player who can keep drives alive on his own. Same could be said about Galvann, however his k/d a min is abysmal compared to the rest of these guys and while k/d certainly does not win games alone, when he is your big push tank that really hurts that he isn’t getting mass positive games. Especially for someone with his play style. He may have good Multis/PM but if his team can’t capitalize on it before his KD starts to suffer than do the multis really matter?
Now let’s not forget about runners. After all the team that scores more is the one who wins. Runners are in a tight spot for this because they especially have a lot of stats that we simply don’t have access to. We don’t know things like successful wraps, launch to score ratios or ball time. Unfortunately, that means this section will be brief with that in mind we have to measure the only ones that we can for runners. Starting with scores, our three best ones all managed to score at least 3 goals a game with the most being 4 goals a game. Nihilius, Doerstopper, and BCK. Now the slight caveat of Nihilius not playing all 20 games is important to mention but we will overlook it for our purposes here. None of these runners made the championship. Stops are a stat that seem to get tacked on to runners so let’s compare the stops between these three. BCK has 83 total stops for .132 a minute. Doer had 70 stops a little less than BCK but slightly more per minute with .143 S/PM. NIhilus just 35 stops and just .079 S/PM that is quite a drop off for the three best runners. However just because he far less stops doesn’t mean he’s any worse than BCK or Doer. His average life is quite a bit higher. :33 seconds. BCK lived for :24 seconds and Doer for :21 seconds. So Nihilus may not be getting the same number of stops but he also isn’t exactly giving the ball up as much as they are. This is reflected again in their deaths per minute stats. Doer had 2.89 D/PM while BCK had 2.50 D/PM. While NIhilus once again survived the longest on the court out of the three with just 1.84 D/PM. So, on paper this tells us that the runner that stays alive simply scores more, and while it’s important for runners to get stops a good runner might not need to get very many and adding stops onto running stats seems, at least in my mind, very arbitrary

I know this has just been me throwing numbers out at you, so thank you for making it this far. Now that all of the big numbers are accounted for let’s try to answer our initial premise. Can stats accurately predict who would win the next season? We’ll no I don’t think they can. At least not the stats we have recorded so far. I do think stats are important metrics but if anything, they can tell us stuff we already knew. Dig is a monster, runners’ pussy foot, KD doesn’t matter as much as just kills. Honestly, I was on the fence of the “do stats matter argument” and now I have that fence post even further up my ass. The only stat that I think matters in these terms is, well, the W. It doesn’t take a rocket scientist to say that, and certainly not four rambling pages in an article. However, that’s where we are. Grifball is a complex game inside a game, and maybe one day we will have access to more stats but right now I don’t think we really can record enough of them to show us what we need to in order to answer our premise. That’s a shame, so hopefully one day we can track the things we currently can’t
I’d like to take some time and thank everyone who helped with this article. Sam and Zeg for providing me these stats and doing all the hard work for me. BCK and Nkot for talking shop with me about this. Sorry I didn’t do any graphs Nkot. Gingy for tossing me his input when I randomly asked, and of course You. For taking time out of your day to read this. Keep your ear out for the ranked custom retrospective article if you liked this one. I hope everyone has a great upcoming season and I can’t wait to see you all on the court.